Back to Dude Intelligence for Education Main Menu
Key Performance Indicators are quantifiable measurements that show how effectively your organization is achieving key business objectives and compares your performance to peers in your industry. They are commonly used to evaluate the level of success of a particular activity or progress toward a desirable goal. These KPIs report on volume of work, efficiency, and data quality.
This data is updated every month and includes a rolling 12 months worth of data. For example, if you are viewing your KPIs in March 2017, then you will see data from the first of March 2016 through the end of February 2017.
- To download an image of the graph, click on the download icon (
 ).
). - To expand the graph you are viewing, click on the fullscreen icon (
 ).
). - To export your KPI data into an Excel spreadsheet, click on the Excel icon (
 ). *Note: This will only export the data, not the graphs.
Volume KPIs
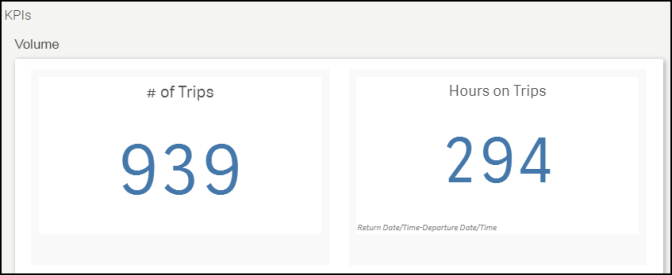
Volume KPIs show trip counts and hours according to different metrics. At the top of the screen, you will see the # of Trips entered into your account over the last 12 months. *Note: This includes all Statuses of trips. You will also see the Hours on Trips. This is calculated by taking the Return Date/Time and subtracting it from the Departure Date/Time.
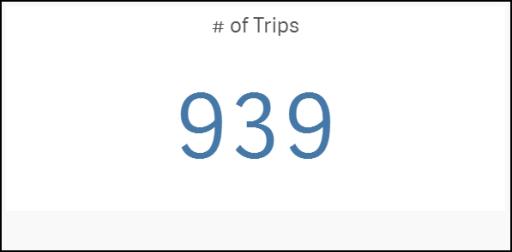
Displays the total number of Trips requested in the past 12 months. *Note: This includes Trips in all statuses.
Displays the total number of hours spent on Trips in the past 12 months. Trip Hours are calculated by subtracting the Departure Date/Time from the Return Date/Time.

Breaks down the number of trips and trip hours by days of the week (Sunday through Saturday).

Efficiency KPIs
Efficiency KPIs show how well your organization is performing according to specific metrics.
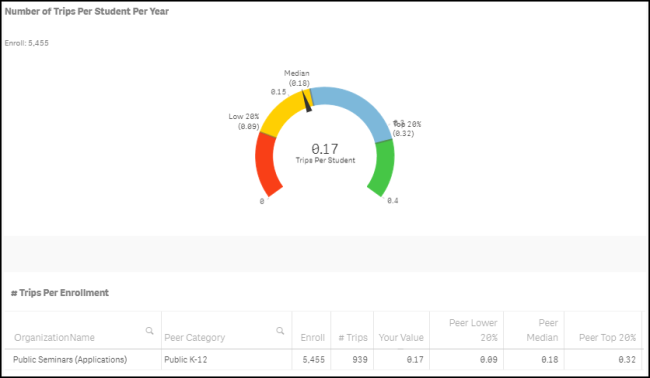
Displays the total number of Trips requested in the past 12 months divided by your student enrollment from the NCES.org database. On the graph, you will see a small indicator that represents where your organization is performing compared to peers in your industry. Your value will be displayed in the middle of the graph.
Green - The green section displays peers in the top 20%.
Blue - The blue section displays peers that are between the median and the top 20%.
Yellow - The yellow section displays peers that are performing below the median.
Red - The red section displays peers that are performing in the bottom 20%.
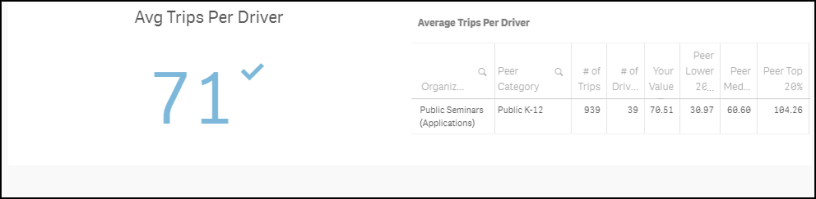
Shows the average number of trips per driver over the last 12 months. *Note: A driver must be assigned at least 12 trips to be included in the calculation.
Shows the average number of trips per vehicle over the last 12 months. *Note: A vehicle must be assigned at least 12 trips to be included in the calculation.

Shows the average number of trips per vendor over the last 12 months. *Note: All vendors are included in this calculation.

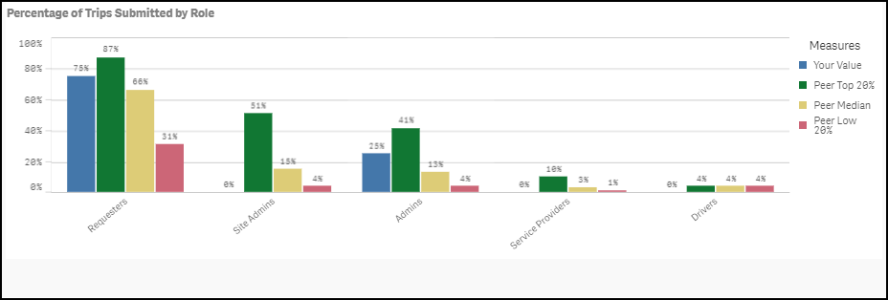
Shows the percentage of trips submitted by user role over the past 12 months.
Blue - The blue bar displays your organization's value.
Green - The green bar displays peers in the top 20%.
Yellow - The yellow bar displays peers that are performing in the median or average range.
Red - The red bar displays peers that are performing below average.
Cost KPIs
Cost KPIs show various costs related to Trips
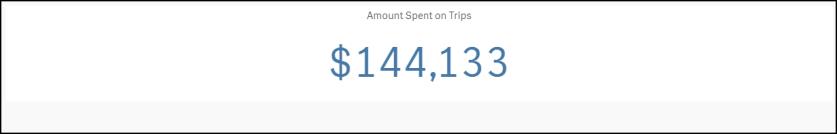
Displays total cost for all Trips requested over the past 12 months. *Note: This includes Trips in all statuses.
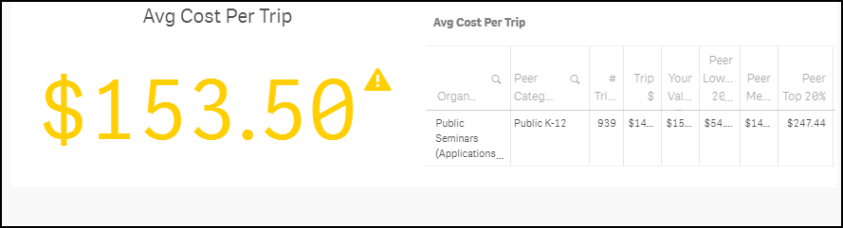
Shows the average cost per Trip over the past 12 months.
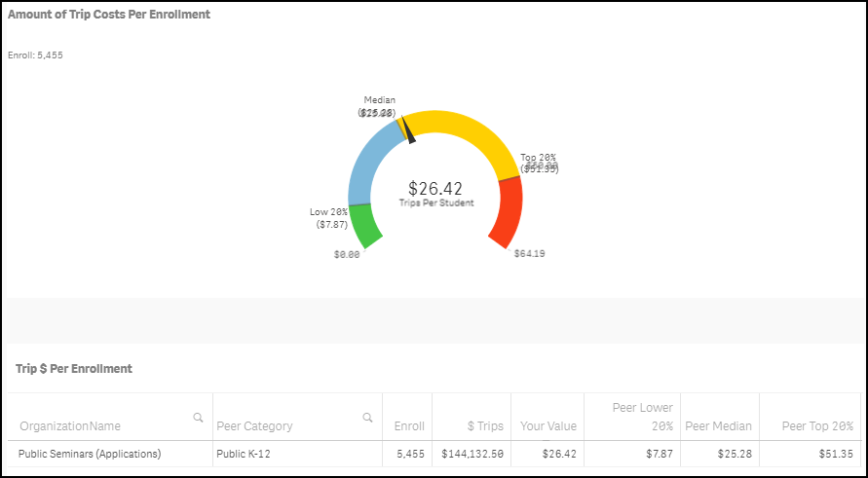
Shows the total cost for all Trips requested over the past 12 months divided by your student enrollment from the NCES.org database. On the graph, you will see a small indicator that represents where your organization is performing compared to peers in your industry. Your value will be displayed in the middle of the graph.
Green - The green section displays peers in the top 20%.
Blue - The blue section displays peers that are between the median and the top 20%.
Yellow - The yellow section displays peers that are performing below the median.
Red - The red section displays peers that are performing in the bottom 20%.
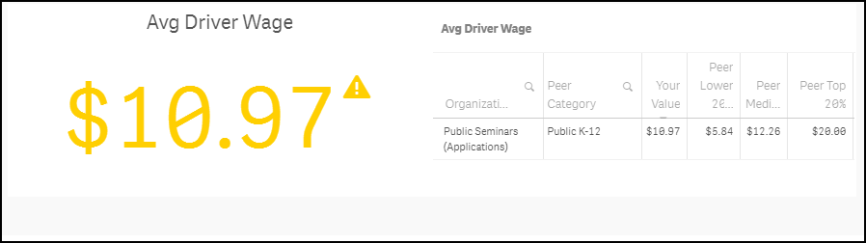
This calculation averages all of the Hourly Wages entered on the Driver Shift table.